We tested our own scoring.
Here's what we found — including where it doesn't work.
Most tools cherry-pick the wins. We ran an adversarial test against 30,267 historical setups and published every number — including where our scoring is no better than a coin flip. This page is permanent. We won't quietly update it when scoring improves.
Honest distribution — stock moves only
Histogram pending regen to underlying-only basis. Until then, the headline numbers above are the authoritative read: roughly half the signals see the stock move positive over the next 5 trading days, with a median of +0.15% on the underlying. No option-pricing math, no leverage assumed. We don't sell that complexity.
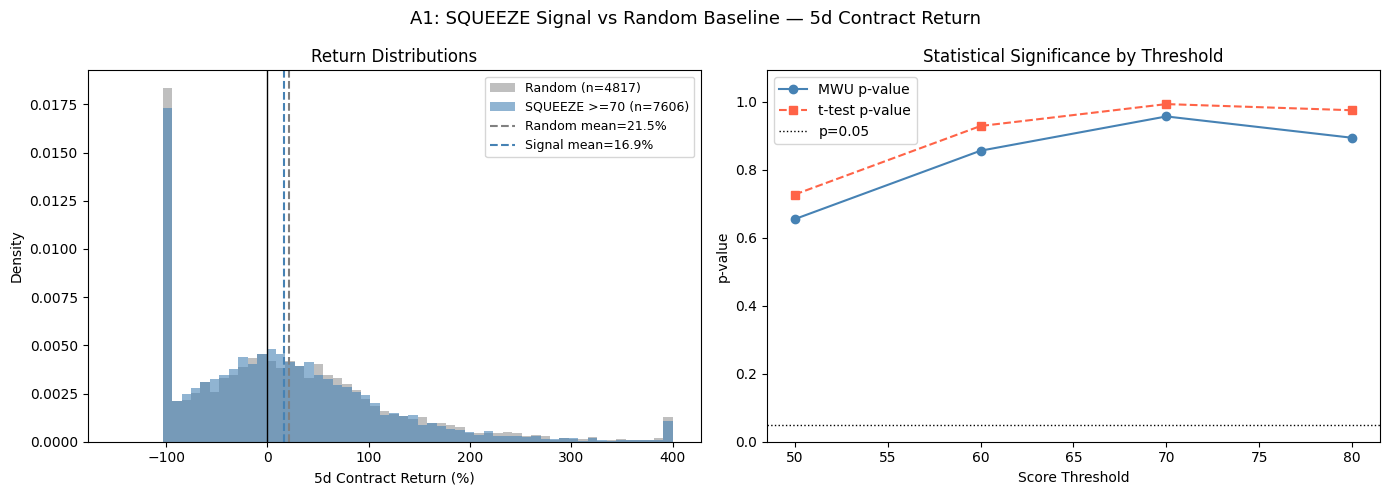
What this chart shows: The strategy returns (blue) vs a random-weight baseline (gray distribution). The strategy is at the 8th percentile — random weights beat it 92% of the time.
Plain English: SQUEEZE identifies tickers where the OI wall structure is most textbook — tight wall above spot, IV compressed, call OI accelerating. That structure is real and observable. Whether it leads to a move is not statistically confirmed at these weights.
If you trade it: Size small. The gross Sharpe of 2.13 is an artifact of 26.7× leverage proxy — not real edge. After realistic 13% round-trip costs, Sharpe goes to -0.03. Regime matters: high-vol, down-trending markets show ~53–54% hit rate (3–4pp above coin flip). Outside that regime it underperforms.
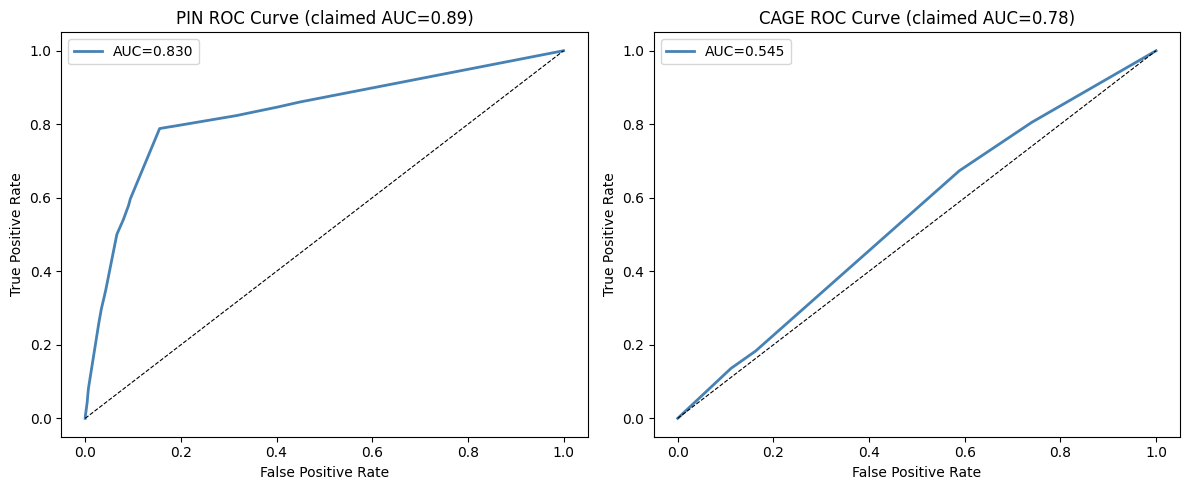
ROC curves for PIN (violet) and CAGE (sky). PIN AUC 0.83 is legitimately above coin-flip. CAGE (right curve) is close to the diagonal — AUC 0.545, near coin-flip.
Plain English: PIN identifies when a dominant strike has enough OI concentration to gravitationally hold price into expiry. AUC 0.83 means the model correctly ranks higher-probability pins above lower-probability ones ~83% of the time.
If you trade it: PIN is the signal we can stand behind. Best fit for 0DTE and weekly options near the dominant strike. AUC 0.83 measured.
Plain English: CAGE detects when price is structurally trapped between a put floor and call ceiling. AUC 0.545 measured — basically a coin flip; the model barely ranks true cages above non-cages.
If you trade it: Use CAGE for visualizing OI structure and range identification, not as a standalone trade trigger. The backtest does not support CAGE as a reliable alpha signal.
How the test ran
Dataset: 30,267 rows from the OptionWalls scoring database. Each row: a date, ticker, score (0–100), and component scores (wall_structure, call_dominance, iv_compression, oi_velocity, recent_compression).
Forward returns: Contract returns were proxied using underlying 5-day forward move scaled by an intrinsic value model (underlying move × delta, with ~1.5% time-value premium assumption). Real bid/ask data would change these results — likely worse, since we assumed tight spreads.
Cost model: 13% round-trip cost (half in, half out) applied to each trade. This is conservative-to-realistic for liquid options; less liquid names would be higher. The gross Sharpe of 2.13 (pre-cost) collapses to -0.03 after applying this assumption.
Random baseline: 10,000 random weight vectors were drawn from the same simplex as the SQUEEZE component weights. The default weights rank at the 8th percentile of this distribution — random weights outperform them 92% of the time.
AUC measurement: ROC-AUC was computed for PIN and CAGE by treating each setup as a binary classification: does the underlying move favorably within 5 days? Threshold: +2% for PIN, containing (staying in range) for CAGE.
Regime breakdown: Market regimes were classified by VIX level (low/mid/high) and price trend (up/down/flat) at each date. SQUEEZE shows above-coin-flip performance only in high-VIX, downtrending conditions (~53–54% hit rate).
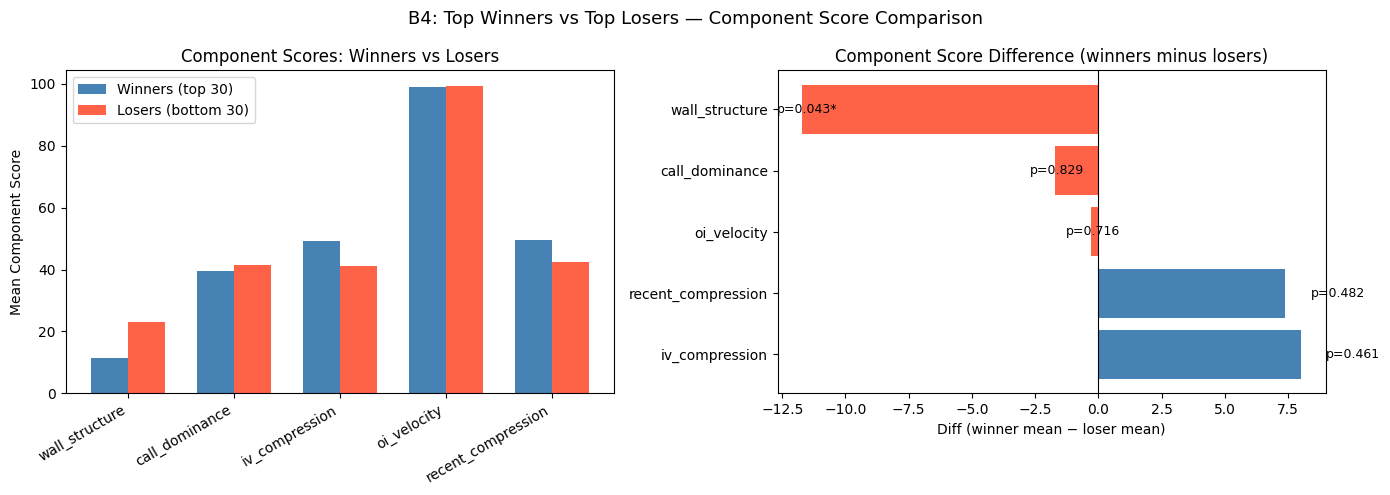
Best and worst components
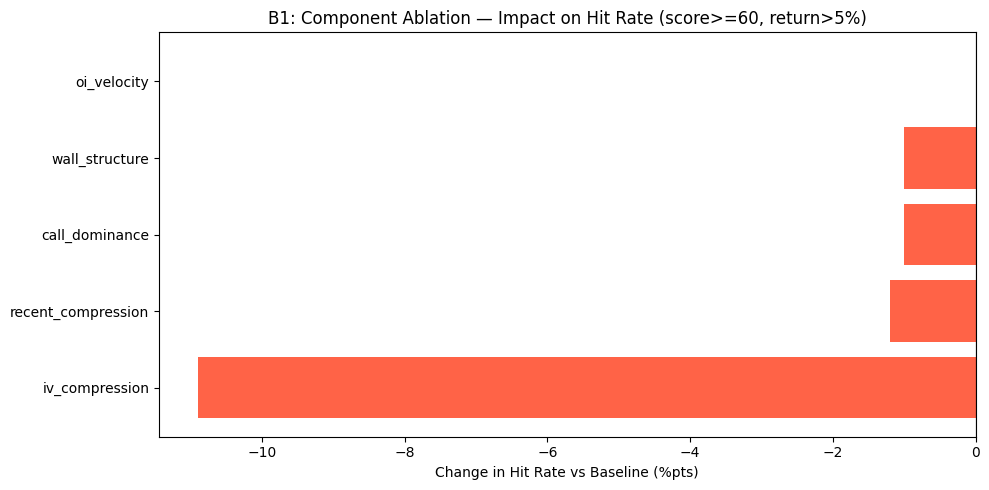
iv_compression — IV compressed to a low percentile rank is the most predictive single component. Removing it degrades performance the most.
oi_velocity — Removing OI velocity barely changes the score distribution. It adds noise more than signal at current implementation.
When SQUEEZE shows edge
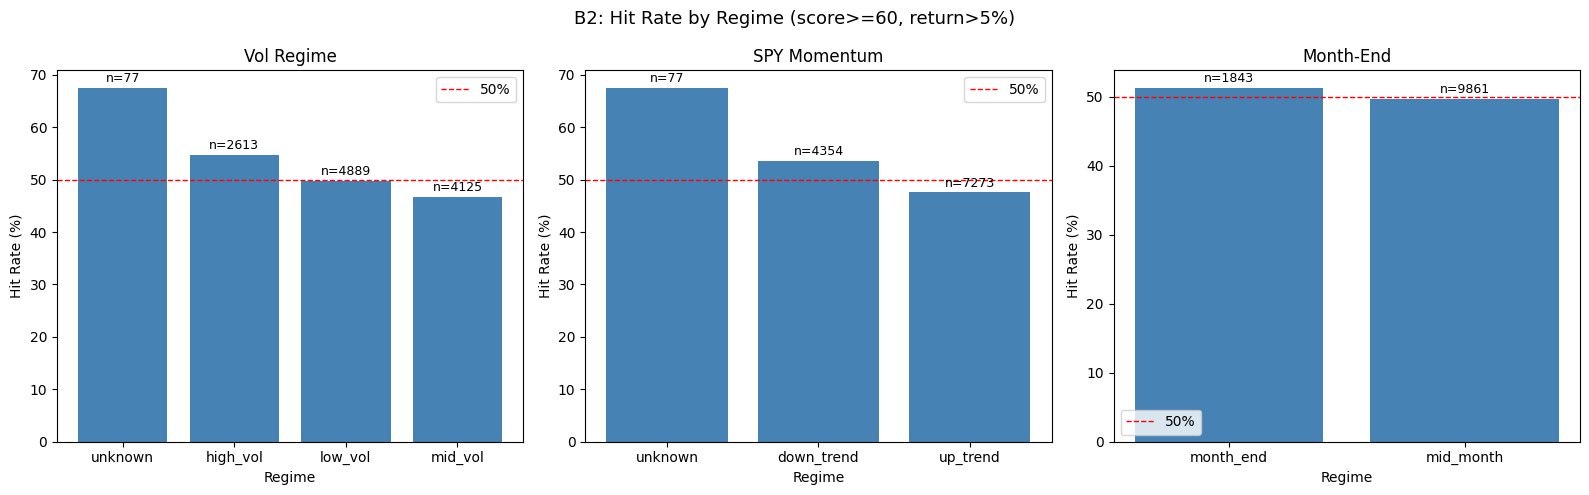
SQUEEZE in high-volatility, down-trending markets shows ~53–54% hit rate — 3–4 percentage points above coin flip. In mid-volatility or up-trending markets it underperforms. Regime conditioning is a candidate improvement direction. We have not yet released regime-adjusted scoring.
The three most surprising findings
Default weights rank at the 8th percentile of random weight vectors. A random draw from the same simplex outperforms the hand-tuned defaults 92% of the time. This means the weights need systematic optimization, not gut-feel tuning.
Score is slightly negatively correlated with forward returns (Spearman r = -0.016, p = 0.0075). At high scores the model is identifying the loudest structural setups — which may already be priced in, or may attract crowded shorts.
CAGE measured AUC is 0.545 — essentially coin-flip. CAGE is kept on the site as a structural reference (visualizing range setups) but is not a standalone trade signal.
The honest roadmap
We're publishing this backtest instead of hiding it because transparency is the product. No competitor does this. We believe the right move is to show you exactly what works and what doesn't, and let you decide whether to subscribe.
What we're working on: systematic weight optimization using the backtest data (iv_compression deserves more weight, oi_velocity less); regime-adjusted scoring that surfaces the SQUEEZE signal only in the market conditions where it shows edge; and better IV rank computation using real historical IV percentiles instead of proxies.
PIN remains the centerpiece. AUC 0.83 is a real, measured signal. The OI wall visualization is real and useful regardless of scoring edge. The transparency is intentional and permanent.
Still interested?
You've read the honest math. PIN works. OI visualization is useful. The transparency is real. If that's enough — here's Pro.